
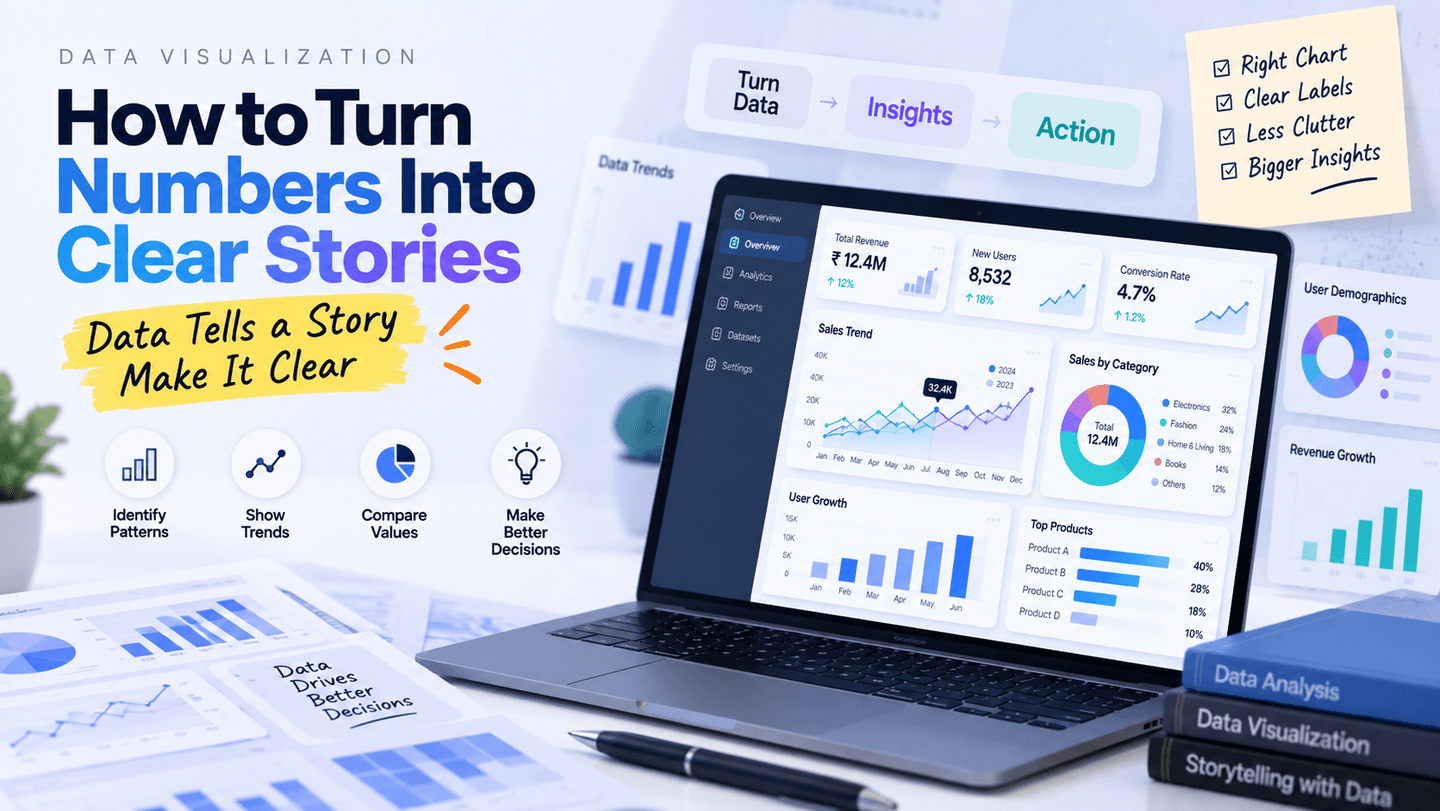
Learn practical data visualization principles for choosing charts, creating hierarchy, reducing clutter, and communicating insights effectively.
Data Visualization: How to Turn Numbers Into Clear Stories
A good data visualization does more than display numbers. It helps people identify patterns, compare values, understand trends, and make decisions.
Start With the Question
Before selecting a chart, define what you want the viewer to understand. Are you comparing categories, showing a trend, explaining a distribution, or highlighting a relationship?
Choose the Right Chart
Bar charts are useful for comparisons. Line charts work well for trends over time. Tables can be effective when exact values matter.
Create Visual Hierarchy
Use size, position, spacing, labels, and emphasis to guide attention toward the most important information.
Reduce Clutter
Remove unnecessary decoration, excessive gridlines, confusing legends, and redundant labels. Every element should support comprehension.
Use Clear Labels
A viewer should not have to guess what an axis or metric means. Include useful units, dates, categories, and context.
Design Better Dashboards
Group related metrics, create a logical reading order, and avoid placing too many unrelated charts on one screen.
Add Context
Numbers become more useful when users can understand whether a value is high, low, increasing, decreasing, or outside an expected range.
Final Thoughts
Data visualization is a communication skill. The best dashboard is not the one with the most charts—it is the one that helps users understand the right information quickly.