
Excel, SQL or Power BI: What Should a Data Analyst Learn First?
Excel, SQL or Power BI: What Should a Data Analyst Learn First?
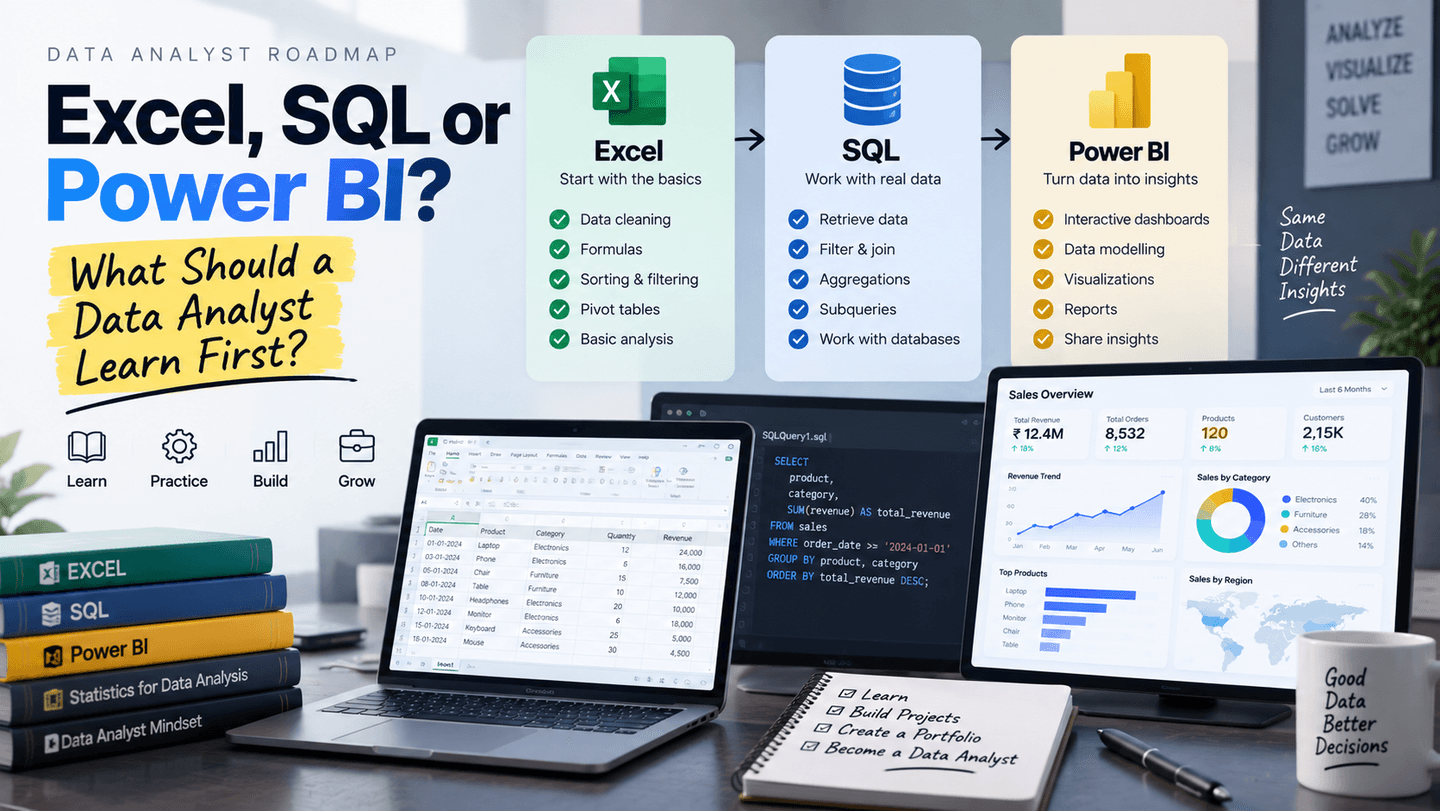
Beginners often wonder whether they should start with Excel, SQL, Power BI, or another analytics tool. The best approach is to understand what each tool does and learn them in a logical sequence.
Start With Excel
Excel is useful for learning data cleaning, formulas, sorting, filtering, pivot tables, and basic analysis. It provides a practical introduction to working with data.
Then Learn SQL
SQL becomes important when data is stored in databases. It helps analysts retrieve, filter, join, aggregate, and prepare data for analysis.
Add Power BI
Power BI can help turn data into interactive dashboards and reports. It is particularly useful for presenting findings to stakeholders.
Why Learn All Three?
The tools solve different parts of the workflow.
Excel can support quick analysis.
SQL can retrieve and transform database data.
Power BI can communicate insights through dashboards.
What About Statistics?
Tools alone are not enough. Learn basic statistics and analytical thinking alongside them. An analyst needs to interpret results rather than simply produce charts.
Build an End-to-End Project
A useful practice project can start with raw data, clean it in Excel or another tool, query it using SQL, and present the findings in a dashboard.
Final Thoughts
A practical learning order for many beginners is Excel fundamentals → SQL → data visualization and Power BI → deeper statistics and advanced analytics. Focus on understanding the problem, not just the software.