
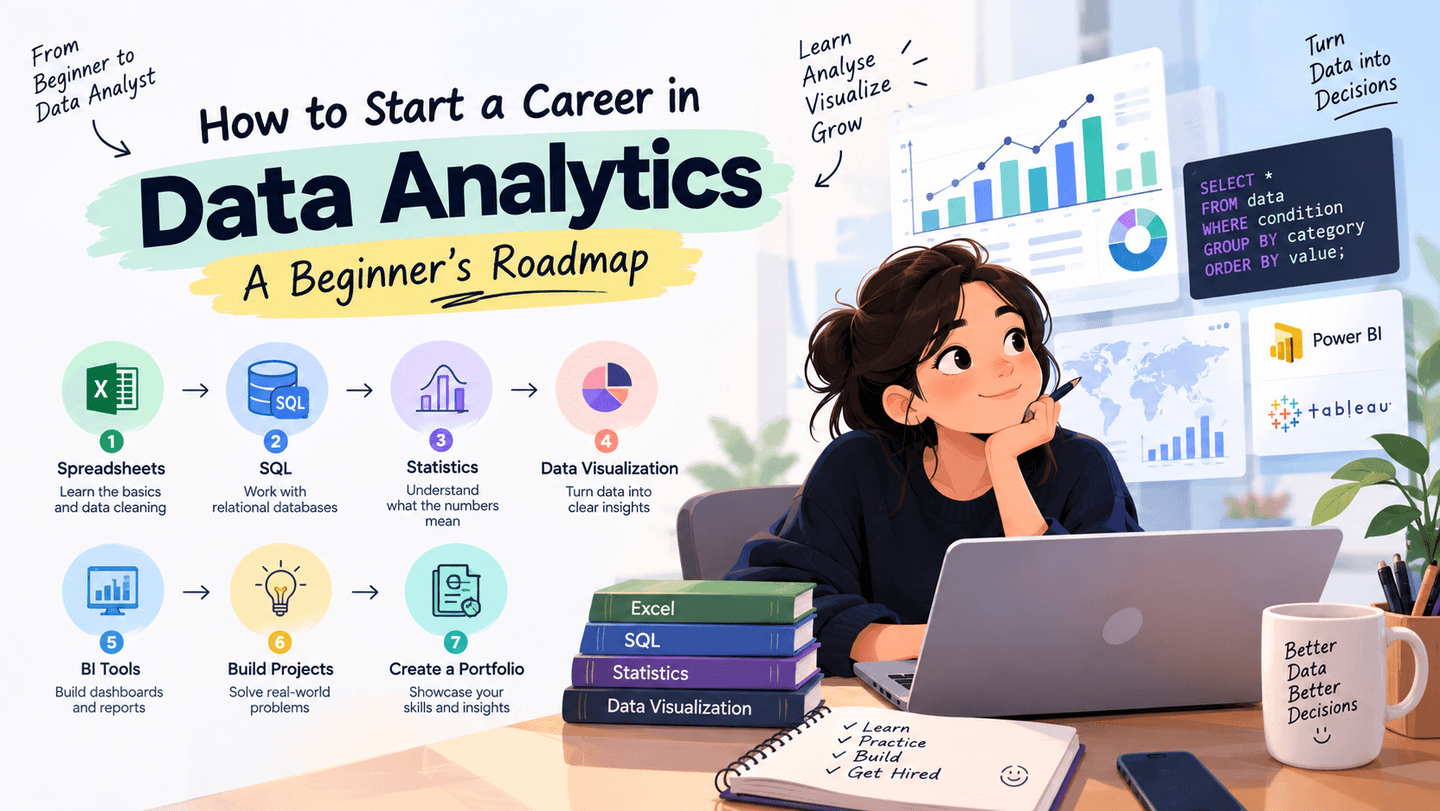
Follow a practical beginner roadmap for learning data analytics, including spreadsheets, SQL, data visualization, statistics, projects, and portfolio building.
How to Start a Career in Data Analytics: A Beginner's Roadmap
Data analytics helps organizations understand information and use evidence to support decisions. It combines data preparation, analysis, visualization, and communication.
Start With Spreadsheets
Learn formulas, sorting, filtering, conditional logic, pivot tables, and basic data cleaning. Spreadsheets are useful for understanding how structured data works.
Learn SQL
SQL is important for working with relational databases. Start with SELECT, WHERE, GROUP BY, ORDER BY, JOIN, aggregations, and subqueries.
Understand Basic Statistics
Learn averages, percentages, distributions, correlation, sampling, and basic statistical reasoning. The goal is to understand what the numbers actually mean.
Learn Data Visualization
Charts should communicate a message clearly. Learn when to use bar charts, line charts, tables, and other visual forms.
Explore BI Tools
Business intelligence tools can help analysts create dashboards and reports. Focus on data modelling, calculated fields, filters, and clear storytelling.
Build Projects
Create projects around realistic questions such as sales performance, customer behaviour, marketing performance, or operational trends.
Build a Portfolio
Document the question, dataset, cleaning process, analysis, key findings, visualizations, and recommendations.